OCI Document Understanding is an AI service that enables developers to extract text, tables, and other key data from document files through APIs and command-line interface tools.
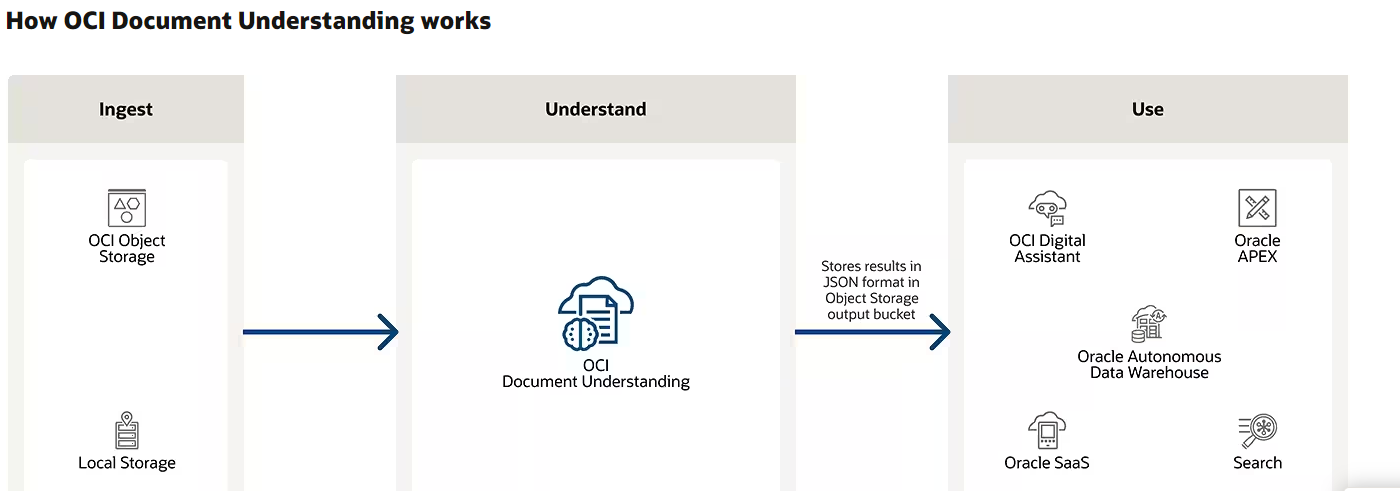
In this blog, I will show you how we can visualize invoices in Oracle Analytics using AI document understanding pre-trained model.
Pre-requisite:
1. Upload sample invoices in OCI bucket object storage
2. Create an Oracle Analytics Could Instance in OCI
Steps:
1. Create a CSV file:
Once we have all invoice images in the bucket, we have to create a CSV file including your bucket URL.
something like below.

2. Register model in Oracle Analytics Cloud (OAC):
Go to the Analytics home page and click on 3 dots in top right corner select Register Model/Function and then select OCI Document Understanding Models

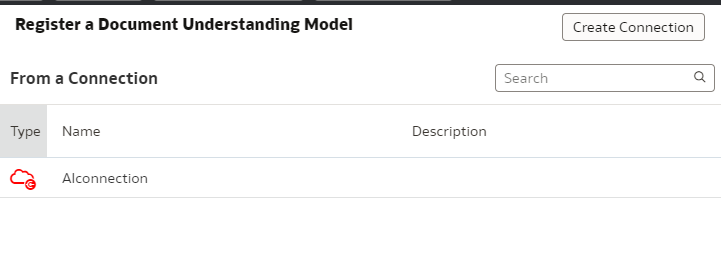
Once selected, create a new connection by clicking the Create connection button. I already have a connection so I select that.
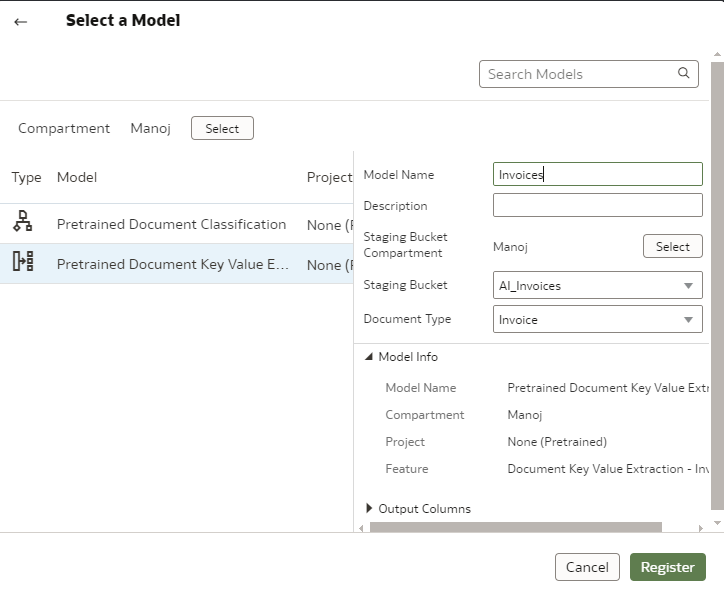
On the next screen, you have to select Model, I select Pretrained Document Key Value Extraction and select compartment, bucket (where we upload all invoices), document type (I select invoices), and give any name to Model.
3. Apply AI Model to our images:
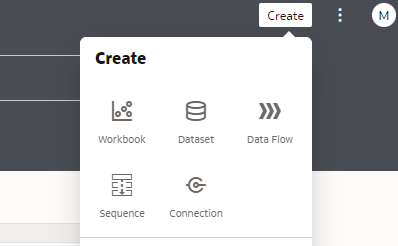
On the Analytics homepage, click on the Create button from the top right corner and click Data Flow.
On this screen, we have to choose the CSV file we created in Step 1 and click add.
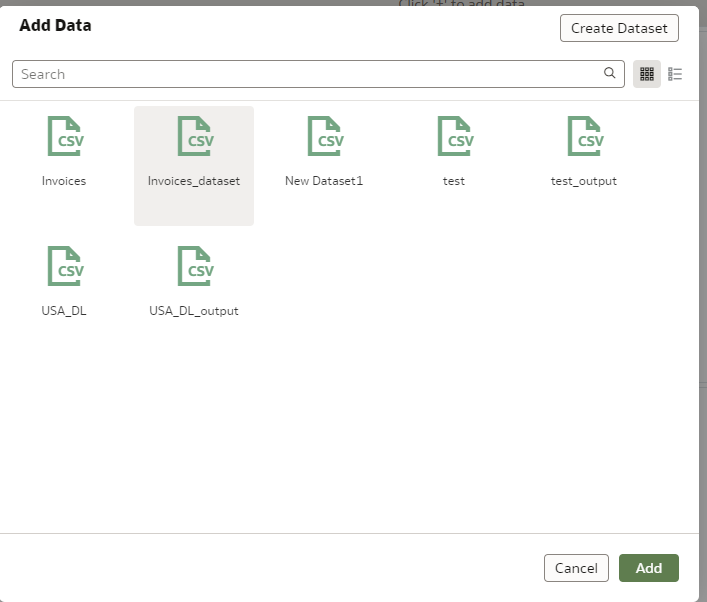
You will see the below screen.
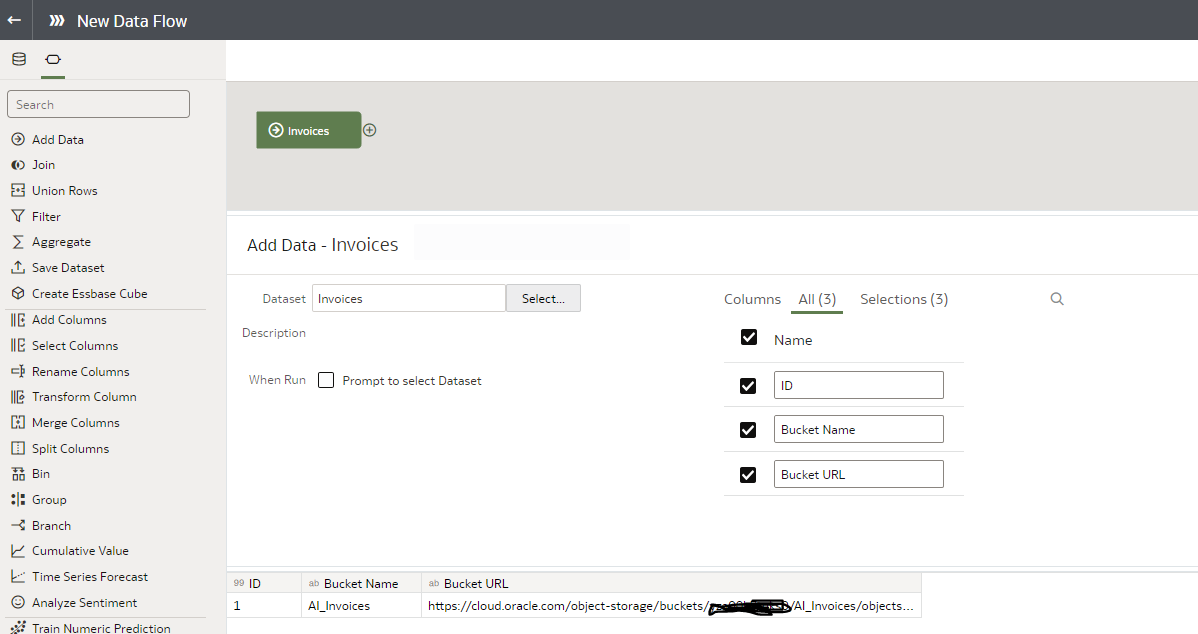
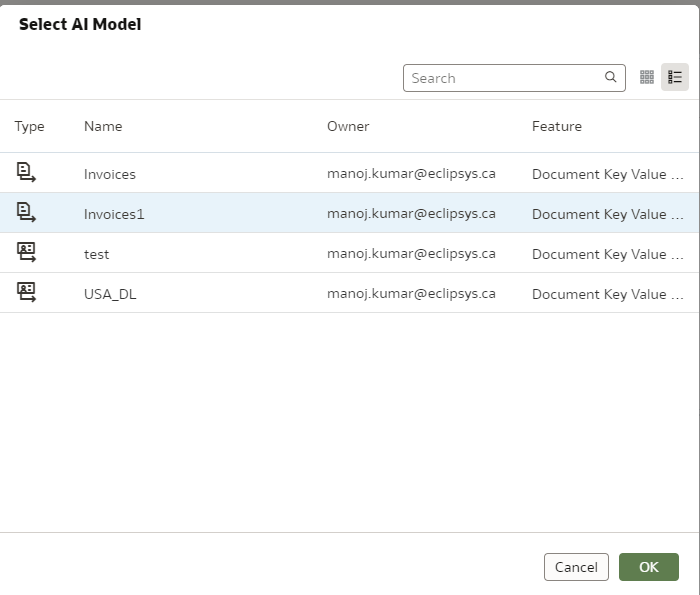
Now click on the + sign click on Apply AI Model select the model we created in step 2 and click ok.
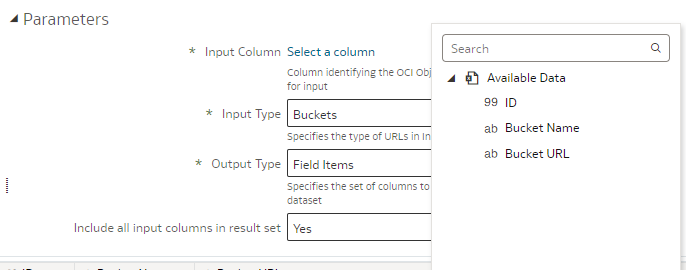
Then scroll down and under parameters select the column as Bucket URL.
Now again click on + sign and select Save data. Saved data should contain the image name and URLs as well as the key values text/number extracted.

Now after a few minutes, you will see all the data. Data flow will load the images, analyze them with a pre-trained AI model, and extract key values from the images. In this example, the invoices.
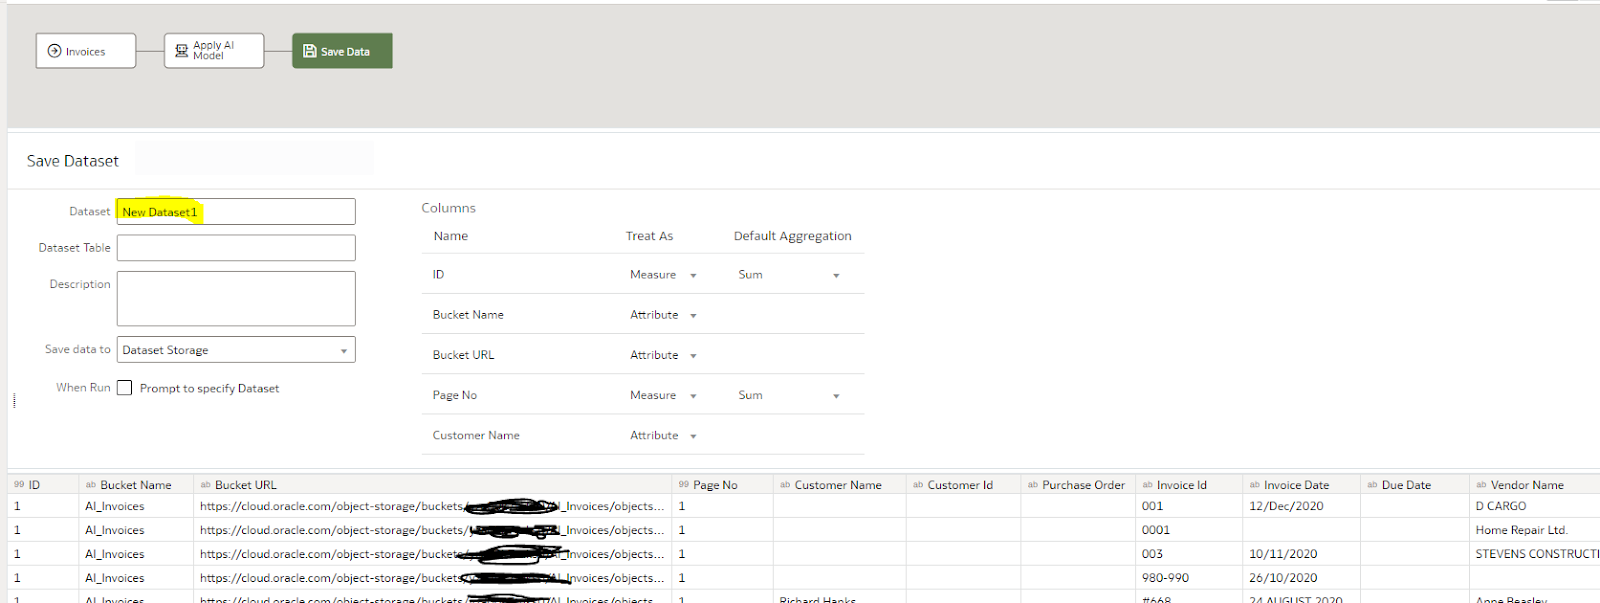
Data flow will load all the information into a dataset that we can use to explore and visualize.
4. Now Visualize the Dataset:
From the Oracle Analytics home page again click on Create and click Workbook
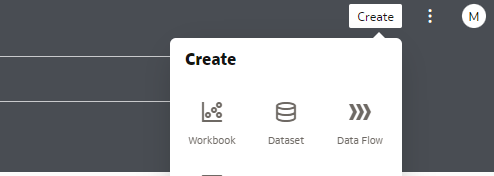
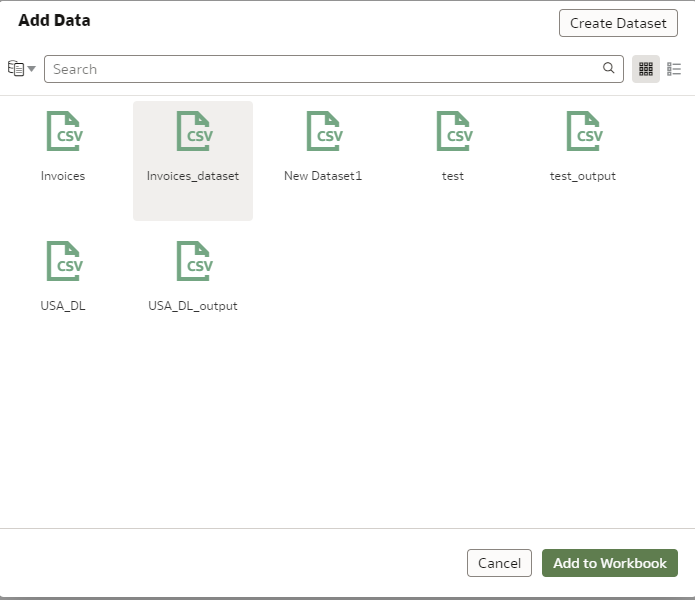
Click on the new dataset generated by the data flow in the previous step and add it to the workbook.
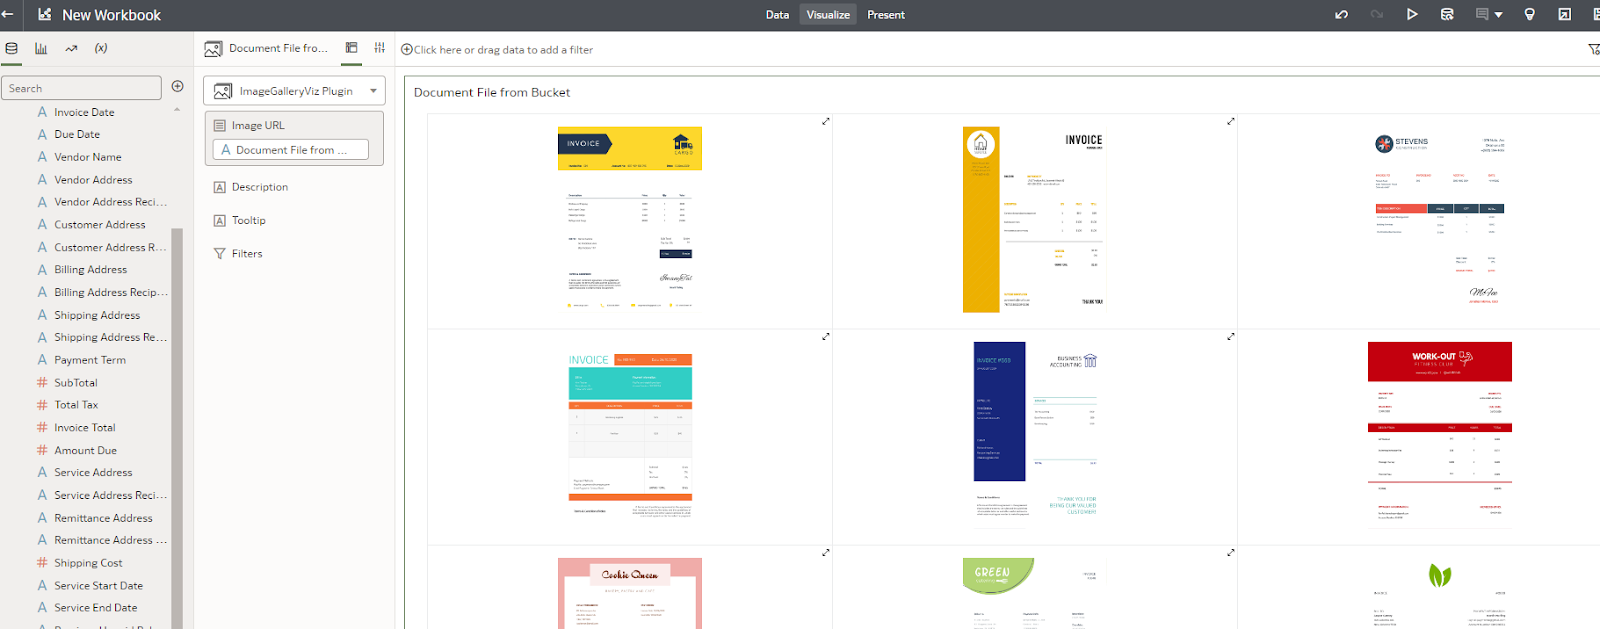
Now from the Visualization, add the custom visualization plugin object to see all the images in your bucket.
On how to download and use custom visualization see my other blog custom plugin
Create a new table to show all the columns of your dataset or maybe a few columns whatever is required.
something like below

I use the filter on image objects so when I click on any image it will show the data of that invoice on the right side.

This is cool! You can do many other things like show only invoices where the Invoice total is more than $1000 etc.
You can also store the dataset result in an Oracle Autonomous Database to do more things.